
The World Cup is football’s biggest spectacle. Every four years, it brings together communities, unites fanbases, and inspires generations.
From dramatic last-minute winners and renewed rivalries to giant-killings, underdogs, historic hat-tricks, and stunning comebacks, every tournament provides unforgettable memories.
But few resonate quite like the hometown hero: the player who steps onto the global stage and becomes a local legend, bringing pride and joy to a community thousands of miles away.
That’s why we created Players Postcode, a new data study commissioned ahead of this summer’s tournament.
By exploring the regional roots of players, the research uncovers the countries, cities, states, and clubs that have produced the most World Cup heroes across the men’s and women’s game since 1950.
Which Places Have Produced the Most World Cup Winners?
There have been 616 World Cup winners from 348 different cities, states or towns across the globe. In total, eight different nations have won the men’s World Cup, and five have lifted the women’s World Cup.
Looking at overall success since 1950 across men's and women’s tournaments, Brazil leads the way with 111 winners, the most of any country in the world. Germany follows closely with 110, ahead of the United States (84), Argentina (70), Spain (46) and France and Italy (45).
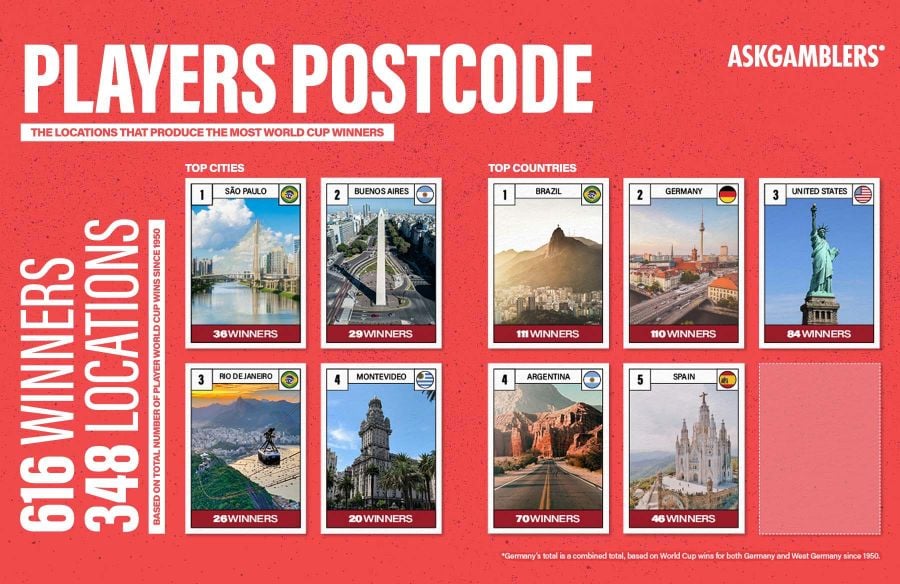
Zooming in further, South America’s major cities have proven to be consistent hotspots for local legends, based on the birthplaces of World Cup winners analysed by AskGamblers.
São Paulo stands out at the city level, responsible for 36 World Cup winners, the most of any city worldwide. This accounts for 5.9% of all champions, or roughly three in every 50 winners.
Brazil’s two most populous cities, São Paulo and Rio de Janeiro, together account for 62 World Cup champions, around one in every 10 globally.
Elsewhere, the capitals of both Argentina and Uruguay have been similarly successful. Buenos Aires (29) has produced one in every 20 winners (4.7%), and Montevideo (20) is the hometown of the third-highest number of World Cup winners since 1950.
The Places That Have Produced the Most World Cup Stars for England
A total of 349 players have represented England at a World Cup since 1950, with 340 players born in 137 different locations across the country.
One in every 20 World Cup stars for the Three Lions or Lionesses was born in Liverpool (17), followed by Manchester (12), County Durham (9) and Sheffield (9).
The two biggest cities in the North West of England have produced one in 12 (8.3%) stars to represent England at the World Cups.
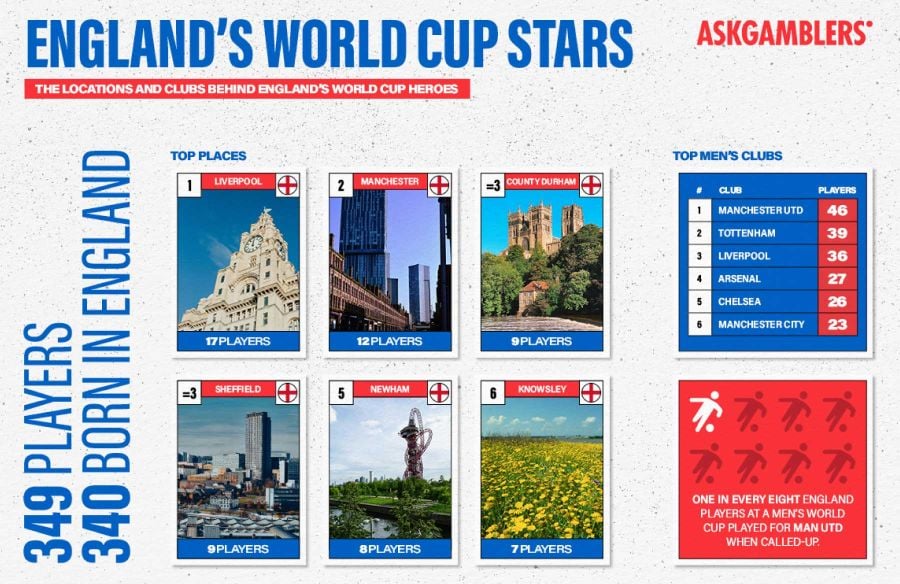
Newham was found to be the best-producing London borough, with eight players, including Ezri Konsa, Johnny Haynes and Ledley King, growing up in the East London area.
One in every eight players representing England at a men’s World Cup played for Manchester United when called up, making the Red Devils the most represented of any club team.
Additionally, twice as many Man Utd players (46) have represented England at the tournament, compared to local rivals Manchester City (23).
The traditional ‘top six’ Premier League clubs make up over half (51%) of the players to have represented the Three Lions at a men’s World Cup, with 51 different teams having had players represent England at the tournament since 1950.
Glasgow Has Produced the Most World Cup Stars for Scotland
The Scottish men’s team will be competing at a World Cup for the first time since 1998 this summer, taking the tally of players to represent Scotland at a World Cup for either the men’s or women’s team to 186.
Twenty-nine different locations in Scotland have generated World Cup stars, but almost one in every four (22.6%) are from Glasgow.
Edinburgh, the capital of Scotland, ranked second, producing almost one in 10 (8.6%) players, followed by South Lanarkshire, where one in 12 (7.5%) players were produced.
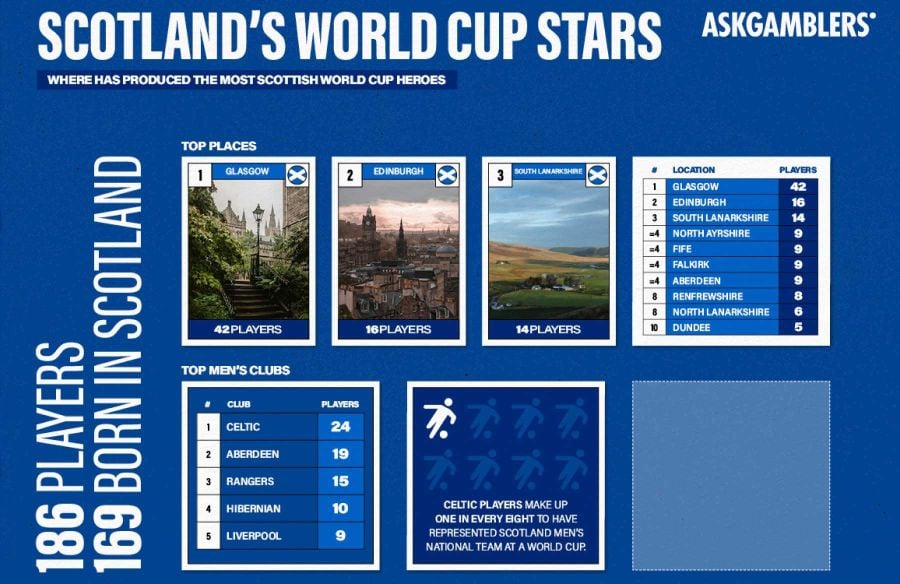
Celtic (24) is the best-represented club, with one in every eight players to represent the men’s national team at a World Cup having played their club football at Celtic Park. This is followed by Aberdeen (19) and Rangers (15).
Liverpool are the best-represented Premier League club in Scotland’s World Cup squad, with one in every 25 players (4.46%) having been playing their club football at Anfield when called up.
The States That Have Created the Most USMNT and USWNT Players
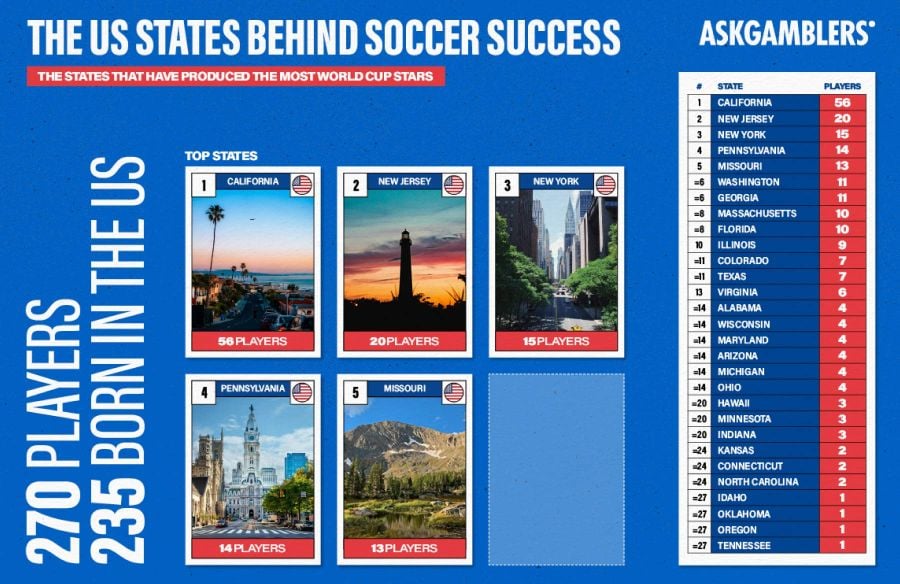
The United States are part of a trio of host nations for this year’s men’s tournament, with the USMNT squad for this year’s tournament set to take the number of players to represent America on football’s biggest stage to 270.
Our research found that just 58% of US states have had representation at a World Cup. Out of 270 players, 235 who represented either the USMNT or USWNT were born in the United States, from across 29 states and Washington, D.C.
Over one in every five (20.7%) of America’s World Cup stars were produced in California. The Golden State was responsible for producing 56 stars of the USMNT and USWNT, the most of any state.
New Jersey (20) and New York (15) are the second and third highest producing states. New Jersey is also the most successful state on average, with 0.27% of residents per thousand selected to represent the US at a World Cup.
Why This Data Matters
Footballers are heroes, idols, and inspirations to millions around the world. By recognising and highlighting their roots, AskGamblers hopes to ensure that the increasingly global game maintains a local connection and continues to offer a unique sense of pride and joy to fans in towns and cities around the world.
Methodology and Sources
AskGamblers compiled a list of all players who have represented England, Scotland, and the USA at a men’s or women’s World Cup since 1950, then used Wikipedia to identify each player's birthplace.
In the US, each birthplace was assigned to the relevant state. In England and Scotland, each birthplace was assigned to the relevant local authority area using the UK Office for National Statistics (ONS) geographical classifications. Depending on the location, this meant categorising players by city, unitary authority, metropolitan borough, or the equivalent ONS administrative area.
To account for differences in population size, we used the latest figures for each area's adult population to calculate the number of World Cup players produced per capita. These locations were ranked by their rate of representation, allowing us to identify where most World Cup players were produced relative to their current adult populations.
We additionally compiled a list of all players who have won the World Cup and used Wikipedia to identify each player's birthplace. We grouped players by city and ranked them by total wins to reveal the cities that produced the most World Cup winners.
*Please note: All data is solely for informational and editorial purposes only and is based on the club a player was at when named in a 26-man squad. World Cup winners data is based on the total number of player World Cup wins since 1950.
